Digital genomic footprinting
Last updated:
Genomic DNase I footprinting enables quantitative, nucleotide-resolution delineation of sites of transcription factor occupancy within native chromatin. We combined sampling of >67 billion uniquely mapping DNase I cleavages from >240 human cell types and states to index, with unprecedented accuracy and resolution, human genomic footprints and thereby the sequence elements that encode transcription factor recognition sites.
Downloads
A web directory containing all of the material for download is available here. Note: the same versions of some of the processed data is also persistently hosted at ZENODO and the ENCODE Project Portal. All files correspond to human genome build GRChr38/hg38. See below for file format descriptions.
-
Metadata containing information about the 243 biosamples analyzed (excel) (corresponds to manuscript Supplementary Table 1)
-
Footprints identified in individual datasets (directory listing)
For each of the 243 datasets you will find the files outlined below. We have organized the files into sub-directories corresponding to each dataset.Filename Description reads.(bam|bam.bai)BAM alignment file from DNase I experiment hotspots.bed.starchDNase I hotspots peaks.bed.starchDNase I peaks dm.jsonDispersion model file qc.pdfQC plots of dispersion model interval.all.bedgraph.(gz|gz.tbi|starch)Per-nucleotide footprint statistics interval.all.obs.bwObserved cleavage counts (bigWig) interval.all.exp.bwExpected cleavage counts (bigWig) interval.all.lnpval.bwPer-nucleotide p-value (bigWig) interval.all.winlnpval.bwWindowed p-value (bigWig) interval.all.fpr.bwFPR adjusted p-values (bigWig) interval.all.fps.*.(bed|bed.gz|bed.gz.tbi|bb)FPR thresholded footprints Note: starch format requries BEDOPS to decompress
-
Per-nucleotide posterior footprint probability (gzipped bedgraph and tabix index)
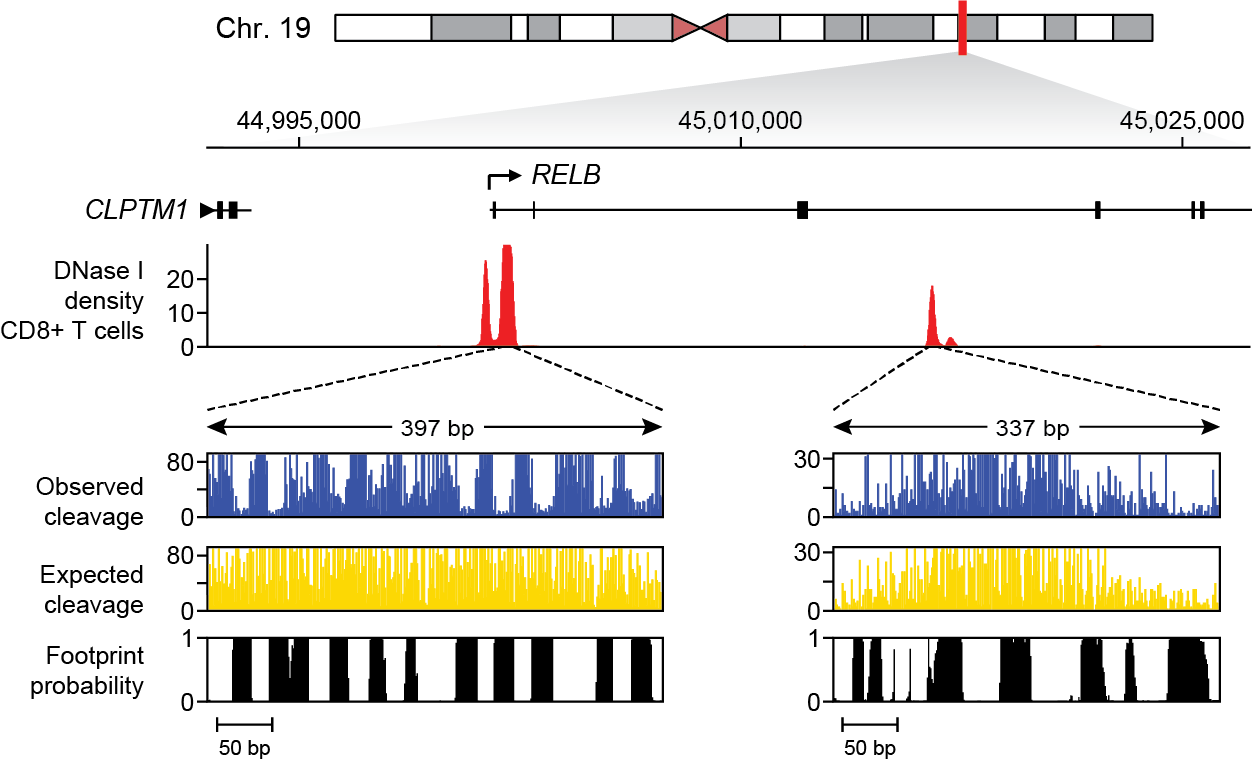
Each row contains the –log transformed posterior probability of footprint in each of the 243 datasets (used to create Fig. 1 of associated manuscript). Columns (biosamples) are in the same order as sample metadata file above (Supplementary Table 1). Genomic positions were excluded if no individual sample has a posterior footprint probability > 0.8.Note that this file is massive (~66Gb) and we have provided a TABIX-index alongside to facilitate remote access using
tabix:[jvierstra@test0 $] tabix https://resources.altius.org/~jvierstra/projects/footprinting.2020/posteriors/posteriors.per-nt.bed.gz chr19:45,001,882-45,002,279 chr19 45001881 45001882 0.0 1.585874187526315e-08 7.332801033044234e-12 1.1864528914884431e-08 2.4502702181905534e-05 ... chr19 45001886 45001887 7.63844553830495e-07 1.0648232517951328e-08 0.0 2.842170943040401e-14 6.063725059846092e-07 ... chr19 45001887 45001888 0.026677374186842684 2.448578051428285e-07 5.897504706808832e-13 4.969464839632565e-10 2.277549524620781e-05 ... ...Additionally, an example of how to remotely access and plot these data using Python can be found here.
-
Consensus footprints (gzipped bed and tabix index)
Re-analysis of the individual datasets using an Emperical Bayesian framework.-
Footprinted motif archetypes (gzipped bed and tabix index)
Motif archetypes matches that overlap consensus footprints (see motif clustering for more information) -
Footprint-by-biosample matrix
Matrix delineating the occupancy of individual consensus footprints (row) in individual biosamples (columns). Biosamples (columns) in same order as sample metadata table.- Binary occupied/unoccupied matrix (gzipped tsv)
- Full posterior probabilities (gzipped tsv)
-
-
Single nucleotide variants tested for allelic imbalance
De novo genotypes derived from 147 individuals and allelic read counts for each variant in all 243 datasets. The assignment of each biosample to an individual is found in Supplementary Table 1 (above).-
Genotype and allelic read depth for each biosample (gzipped vcf and tabix index)
The file format is self-explantory (see header for description viabcftools view -h genotypes.vcf.gz) -
Variants tested for imbalance (combining data by genotype) using Beta-binomial distribution (gzipped bed and tabix index)
-
Visualization
All of the DGF data listed above can be loaded/visualized in the UCSC Genome Browser with the following trackhub (copy & paste into “My Hubs”):
https://resources.altius.org/~jvierstra/projects/footprinting.2020/hub.txt
Alternatively, you can click here to automatically load this trackhub at the Genome Browser hosted at UCSC.
Code & Tutorials
Software and scripts are available at GitHub.
Documentation is hosted at Read the docs. Included in the documentation are examples of how to remotely access, manipulate and visualize genomic footprinting data.
Citation
If you use this resource in your research, please cite:
Vierstra2020 Vierstra, J., Lazar, J., Sandstrom, R. et al. Global reference mapping of human transcription factor footprints. Nature 583, 729–736 (2020)
Acknowledgements
This work was funded through the NHGRI ENCODE Project (NIH grants U54HG007010 and 5UM1HG009444)
Appendix: File format descriptions
Hotspots and peaks
See hotspot2 documentation for file descriptions.
Per-nucleotide footprint statistics for individual datasets (interval.all.bedgraph.gz)
| Column | Example | Description | |
|---|---|---|---|
| 1 | contig |
chr1 | Chromosome |
| 2 | start |
9823494 | Start position (0-based) |
| 3 | stop |
9823495 | End position (start+1) |
| 4 | obs |
24 | Observed DNase I cleavages (both strands combined) |
| 5 | exp |
56 | Expected DNase I cleavages |
| 6 | lnp |
2.1 | –log p-value lower-tail negative binomial |
| 7 | winlp |
14.5 | –log p-value windowed test (Stouffer’s Z) |
| 8 | fdr |
0.0014 | Empircal false-discovery rate |
Consensus footprints (consensus_footprints_and_collapsed_motifs_hg38.bed.gz)
| Column | Example | Description | |
|---|---|---|---|
| 1 | contig |
chr10 | Chromosome |
| 2 | start |
97320044 | Start position (0-based) |
| 3 | stop |
97320056 | End position (start+1) |
| 4 | identifier |
10.754379.4 | Unique identifier (DHS_chom#.DHS_position%.fp_position%; DHS_chrom#.DHS_position% = DHS index identifier) |
| 5 | mean_signal |
55.865317 | Mean footprint -log(1-posterior) across biosamples (“confidence score”) |
| 6 | num_samples |
9 | Number of unique biosamples contributing to this index footprint (posterior >= 0.99) |
| 7 | num_fps |
9 | Number of unique footprints across all samples that contributed to this consensus footprint |
| 8 | width |
12 | Width of consensus footprint (column 3-column 2) |
| 9 | summit_pos |
97320049 | Estimated footprint summit position |
| 10 | core_start |
97320042 | Start position of core-region containing 95% of per-biosample summits |
| 11 | core_end |
97320053 | End position of core-region containing 95% of per-biosample summits |
| 12 | motif_clusters |
CTCF;KLF/SP/2;ZNF563 | Non-redundant motif archetype matches w/ 90% overlap, ; delimited |
Note: A seperate version of this file is also available (consensus_footprints_and_motifs_hg38.bed.gz; gzipped bed and tabix index) where column 12 is the motifs that overlap (≥3np) footprints for all (not-collapsed) PWM models.
Footprinted motif archetypes (collapsed_motifs_overlapping_consensus_footprints_hg38.bed.gz)
| Column | Example | Description | |
|---|---|---|---|
| 1 | contig |
chr1 | Chromosome |
| 2 | start |
1782520 | Start position (0-based) |
| 3 | end |
1782770 | End position |
| 4 | motif_cluster |
TBX/4 | Motif cluster name |
| 5 | score |
0 | BED-score field (not used) |
| 6 | strand |
+ | Strand (+ or -) |
| 7 | thickStart |
1782520 | Same as ‘start’ |
| 8 | thickEnd |
1782770 | Same as ‘end’ |
| 9 | itemRgb |
0,28,255 | RGB string for UCSC browser |
| 10 | best_model |
TBX20_TBX_1 | Best matching motif model from cluster |
| 11 | match_score |
5.4513 | MOODS match score for best cluster match |
| 12 | DBD |
TBX | DNA binding domain family |
| 13 | num_models |
2 | Number of motif models from cluster with a match |
For more information about the motif archetypes see here.
Variants tested for imbalance (tested_snvs_padj.bed.gz)
| Column | Example | Description | |
|---|---|---|---|
| 1 | contig |
chr10 | Chromosome |
| 2 | start |
404425 | Start position (0-based) |
| 3 | end |
404426 | End position |
| 4 | ref |
G | Reference allele |
| 5 | alt |
T | Alternative allele |
| 6 | total_reads |
558 | Number of total reads over variant in het. samples |
| 7 | ref_reads |
196 | Number of reads mapped to reference allele |
| 8 | num_hets |
6 | Number of heterozygous biosamples |
| 9 | allelic_ratio |
0.3513 | Proportion reads mapping to reference allele |
| 10 | bb_test_stat |
0.0017 | Beta-binomial test statistic |
| 11 | adj_p |
0.0468120827793 | Adjusted p-value |
| 12 | dhs |
1 | Overlapping DHS peak (binary indicator) |
| 13 | fps |
1 | Overlapping consensus footprint (binary indicator) |